Page: 1
/ 14
Total 55 questions
Talend Data Integration Certified Developer Data-Integration-Developer Exam Practice Test
Question 1
Using the following input file format as an example:
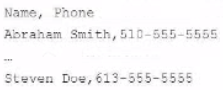
Which tFileinputDelimted component parameters should you configure to parse the input file correctly? Choose 3 answers
Answer : B, C, E
Using the following input file format as an example:
<OCR>Name, Phone Abraham Smith, 510-555-5555 ... Steven Doe, 613-555-5555 </OCR>
The tFileInputDelimited component parameters that you should configure to parse the input file correctly are Schema, Field separator, and Header. The Schema parameter defines the structure and type of the data in the input file. You can use a built-in schema or a repository schema to specify the columns and their properties. The Field separator parameter defines the character that separates each field in a row of data. In this case, it is a comma (,). The Header parameter defines the number of rows to be skipped at the beginning of the file. In this case, it is 1, as the first row contains the column names.
Question 2
Which characteristics distinguish Traces Debug from Java Debug?
Choose 2 answers
Answer : A, D
Trace Debug and Java Debug are two modes that allow you to debug your jobs in Talend Studio. Trace Debug mode allows you to trace each row processed by your job components and see the values of each column in each row. Java Debug mode allows you to debug your job code in Java or Perl and see the values of each variable or expression in your code.
The characteristics that distinguish Trace Debug from Java Debug are:
Trace Debug mode allows row-by-row inspection of data flows, while Java Debug mode does not. Data flows are the links that show the data transfer between components in your job design workspace. In Trace Debug mode, you can see the data flow on each trace and inspect the values of each column for each row processed by your job. You can also use filters to display only the rows that match a condition or an expression. In Java Debug mode, you cannot see the data flow on each trace or inspect the values of each column for each row.
Trace Debug mode supports breakpoints based on input data condition, while Java Debug mode does not. Breakpoints are points where the execution of your job pauses and waits for your action. You can use breakpoints to inspect your data or debug your logic at specific points of your job execution. In Trace Debug mode, you can set breakpoints on traces based on a condition or an expression that involves input data columns. For example, you can set a breakpoint to pause your job when a customer name contains a certain string or when a product price exceeds a certain value. In Java Debug mode, you can only set breakpoints on lines of code based on a condition or an expression that involves variables or expressions.
The characteristics that do not distinguish Trace Debug from Java Debug are:
Both modes require a separate perspective. A perspective is a set of views and editors that are arranged in a specific way to support a specific task. In Talend Studio, you can switch between different perspectives, such as Integration, Debug, Profiling, etc. To use Trace Debug mode, you need to switch to the Debug perspective by clicking on the Open Perspective button and selecting Debug. To use Java Debug mode, you need to switch to the Java perspective by clicking on the Open Perspective button and selecting Java.
Question 3
Question 4
Which methods car you use to specify the schema in a tFilelnputDelimited component?
Choose 3 answers
Answer : B, D, E
The methods that you can use to specify the schema in a tFileInputDelimited component are:
Add the component then drag and drop a generic schema metadata item onto the component. This method allows you to reuse an existing schema that is stored in the Metadata section of the Repository. A generic schema is a schema that is not associated with any specific file format or connection type. You can create a generic schema by right-clicking on Generic Schema in the Repository and selecting Create Generic Schema.
Drag a File delimited metadata item from the Repository onto the design workspace. This method allows you to create a new tFileInputDelimited component with a predefined schema that is based on a specific delimited file. A File delimited metadata item is a metadata item that contains information about a delimited file, such as its path, format, encoding, field separator, etc. You can create a File delimited metadata item by right-clicking on File delimited in the Repository and selecting Create File delimited.
Add the component, open the Component view, select the Built-in schema type, then click the Edit schema button. This method allows you to create a custom schema for the tFileInputDelimited component within the Component view. A built-in schema is a schema that is defined locally for a specific component and cannot be reused by other components. You can edit a built-in schema by clicking on the Edit schema button in the Basic settings tab of the Component view.
Question 5
You want to use the value of a context variable you defined to configure a component, but you do not remember the exact name. You decide to use the auto-completion feature in Talend Studio Studio to get assistance.
Which keystrokes can you use to trigger auto-completion?
Question 6
Question 7
Which statements are true about using the Implicit Context Load feature in Talend Studio?
Choose? answers