Page: 1
/ 14
Total 108 questions
Tableau Desktop-Certified-Associate Tableau Desktop Certified Associate Exam Practice Test
Question 1
Connect to the "Global Superstore" data source and find out which region was having the highest percentage of returned orders in 2013?
Answer : B
Create a left outer join, so that we can calculate the percentage of the returned orders
Create a calculated field ''% of returned orders'':
Drop the Order Date to the filters shelf and select the year 2013
Drop the Region to the rows and % of returned orders to the Text:
Question 2
Connect to the "Kiva Loans - India" data source, which sector's funded amount is closest to the median of all the sectors?
Answer : B
Drop Sector to columns and Funded Amount to Rows.
From Analytics, drop the Median with Quartiles to your view or drop the reference line, select the Median.
Your view will look like this:
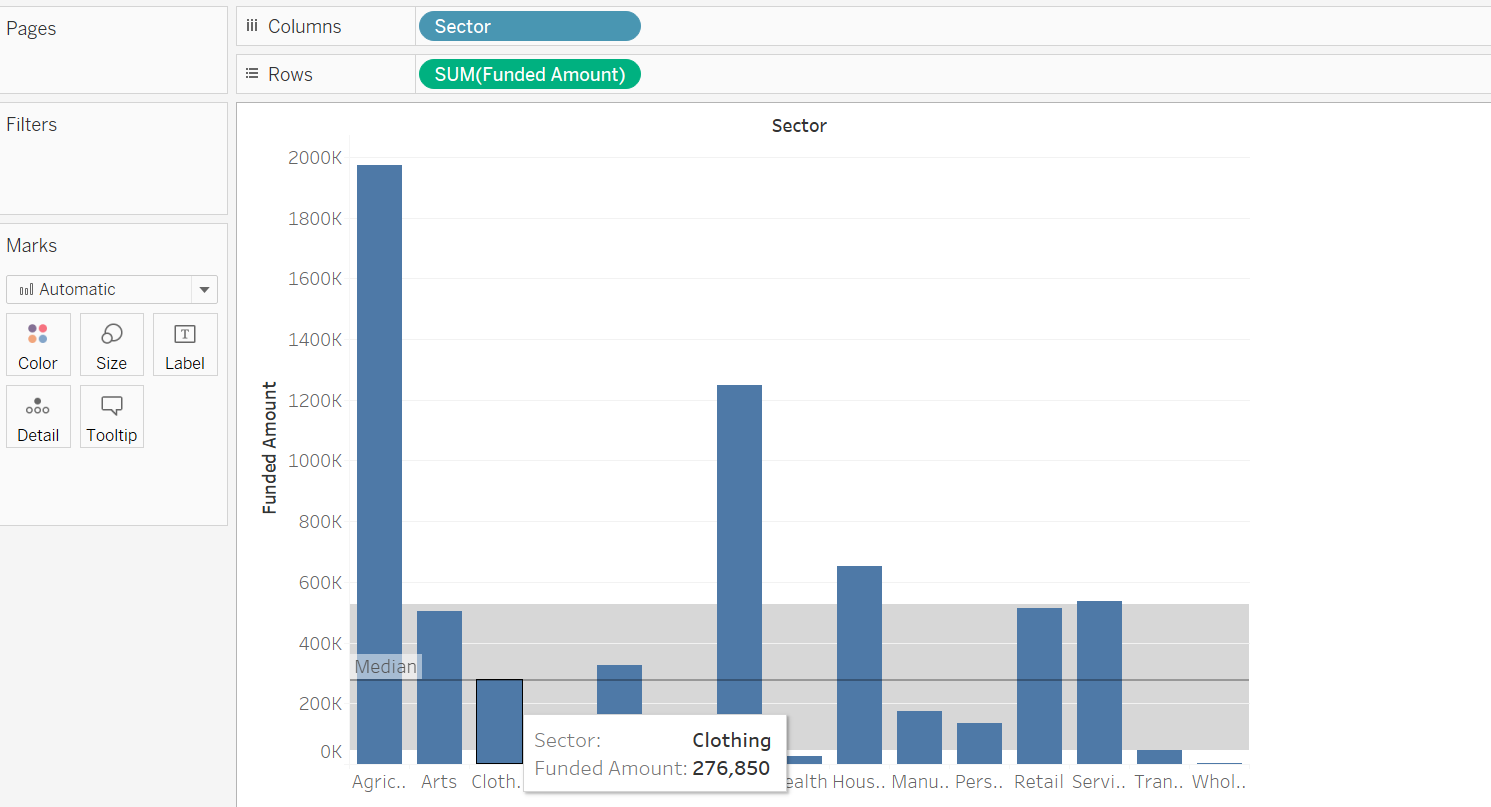
Here, the Clothing funded amount is exactly similar to the Median.
Question 3
You have connected to the employee table in your data source and are adding a join on the Employee Manager table. If you would like to see all of the records from the employee table and only matching records from the employee manager table. Which join type will you use?
Answer : C
When you use a left join to combine tables, the result is a table that contains all values from the left table and corresponding matches from the right table.
Refer Join Types: https://help.tableau.com/current/pro/desktop/en-us/joining_tables.htm
Question 4
While creating which of the chart type, we turn off the stack marks from the analysis menu?
Answer : B
While creating Bar in bar chart, we turn off the stacked marks so that both the bars will start from 0.
Question 5
Using the Sales Analysis Dashboard, If you click on any of the products, it should navigate to the All Products worksheet. How you will accomplish it?
Answer : D
Go to Dashboard->Actions and create the go to sheet action

Question 6
Using the Sales Analysis Dashboard, create a filter action that will trigger once you select any state in Sales by State View, and it should update the Profit Vs Sales view. Find out using trend lines in the Profit Vs Sales view, how much does profit increase for each dollar of sales for the California state?
Answer : B
Go to the Dashboard menu -> Actions -> Add Action -> Filter
Configure the properties as:

Ensure that West Region should be selected in the Region filter.
The final view should be:

profit increase by 0.133134 for each dollar of sales for the California state
Question 7
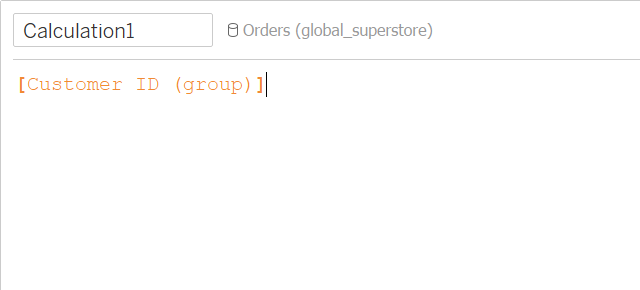
Groups can be used in a calculated field.
Answer : A
Group can be used in a calculated field