Page: 1
/ 14
Total 80 questions
SAP C_THR92_2411 SAP Certified Associate - Implementation Consultant - SAP SuccessFactors People Analytics: Reporting Exam Practice Test
Question 1
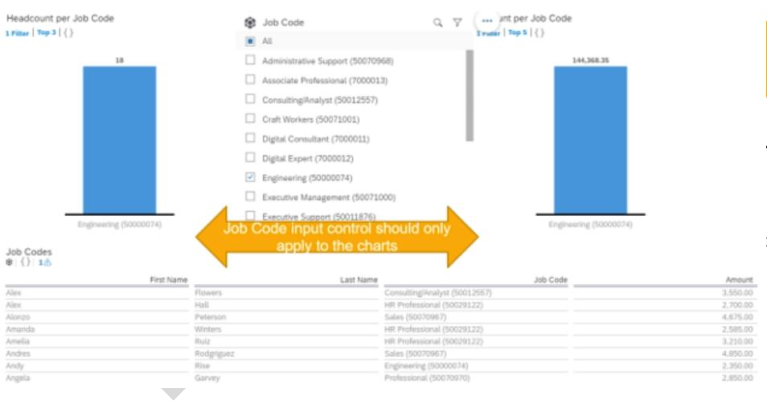
You are creating a Story report on employment and compensation information. You have created two queries to support the story report. The table and the left chart are using an employment query as its data source. The right chart uses a compensation query as its data source. Both queries include the field for the employee Job Title. When you add an input control to the page, it only filters the table and the left chart. What action must you take to configure the input control to effect both charts and the table?
Answer : D
Question 2
You are creating a Story report on Job Classifications. You have configured the chart, table, and input control on the canvas, as displayed in the screenshot. How do you set the input control?
Answer : A
Question 3
The data source used by the two tables only displays current (active) employees. How would you configure a filter on the table End of Previous Year Headcount by Location to display data accurately?
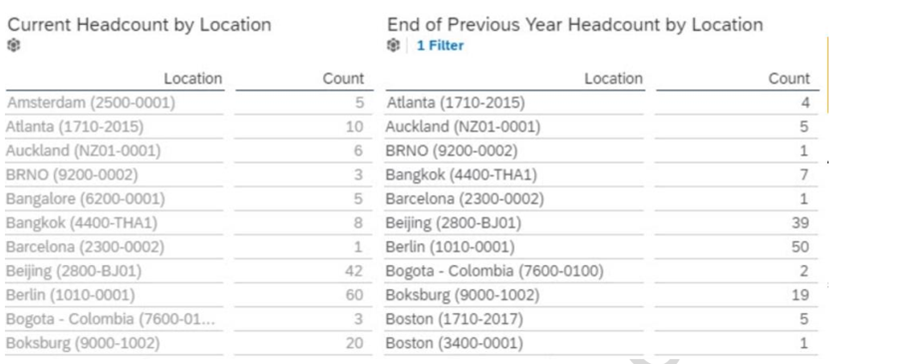
Note: There are 2 correct answers to this question.
Answer : B, D
Question 4
An administrator creates a new MDF object for storing attachments related to an employee's dependents. After uploading some test data, the administrator states they are unable to report on the new data with Advanced Reporting tool in a canvas report. The administrator is working for a client that has already had their system transitioned to Workforce Analytics on SAP HAN
Answer : D
Question 5
Why would you export report definitions? Note: There are 2 correct answers to this question.
Answer : A, C
Question 6
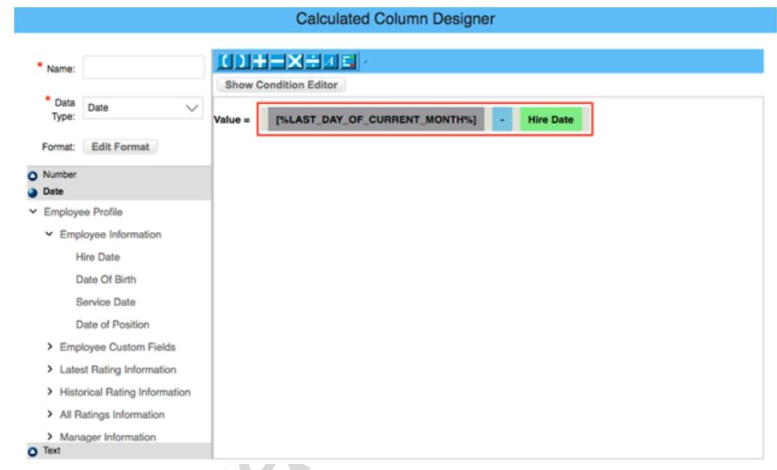
You are creating a calculated column to calculate an employee's organizational tenure. Why does the formula in the screenshot result in an error?
Answer : D
Question 7
You create a report page and want to change the grid column width and grid row height of the Page Designer. Where can you do this?
Answer : C