Page: 1
/ 14
Total 63 questions
Salesforce Marketing Cloud Intelligence Accredited Professional Exam Practice Test
Question 1
An implementation engineer has been provided with the below dataset:
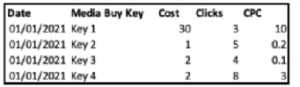
*Note: CPC = Cost per Click
Formula: Cost / Clicks
Which action should an engineer take to successfully integrate CPC?
Answer : A
CPC (Cost per Click) is a calculated metric that should be created using a custom measurement based on the formula provided (Cost / Clicks). This calculation does not require a change in the aggregation setting because it is derived from other base metrics that are already aggregated appropriately. In Salesforce Marketing Cloud Intelligence, custom measurements are used to create new metrics from existing data points, and the system will use the underlying data's aggregation to perform the calculation. Reference: Salesforce Marketing Cloud Intelligence documentation on creating custom measurements and calculated metrics.
Question 2
An implementation engineer has been asked by a client for assistance with the following problem:
The below dataset was ingested:
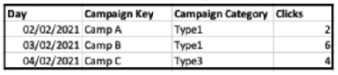
However, when performing QA and querying a pivot table with Campaign Category and Clicks, the value for Type' is 4.
What could be the reason for this discrepancy?
Answer : C
The discrepancy of 'Clicks' being reported as 4 for 'Type1' when the sum of clicks in the dataset for 'Type1' is 8 (2 on 02/02/2021 and 6 on 03/02/2021) suggests that the aggregation function used in the pivot table is set to average (AVG) rather than sum. Salesforce Marketing Cloud Intelligence allows setting different aggregation functions for metrics, and setting it to average would result in such a discrepancy when more than one entry for the same type exists. Reference: Salesforce Marketing Cloud Intelligence documentation on custom measurements and data aggregations explains how to set and understand different aggregation functions.
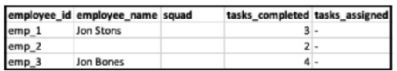
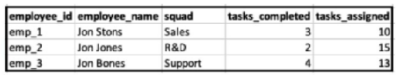
Question 3
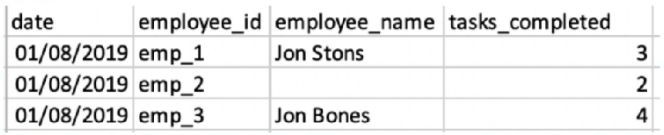
A client has integrated the following files:
File A:
File B:
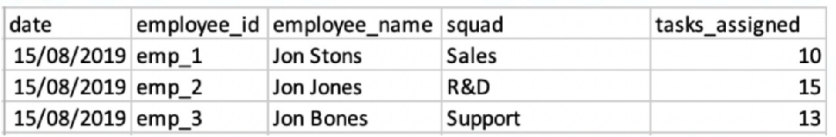
The client would like to link the two files in order to view the two KPIs ('Tasks Completed' and 'Tasks Assigned) alongside 'Employee Name' and/or
'Squad'.
The client set the following properties:
+ File A is set as the Parent data stream
* Both files were uploaded to a generic data stream type.
* Override Media Buy Hierarchies is checked for file A.
* The 'Data Updates Permissions' set for file B is 'Update Attributes and Hierarchy'.
When filtering on the entire date range (1-30/8), and querying employee ID, Name and Squad with the two measurements - what will the result look like?
A)
B)
C)
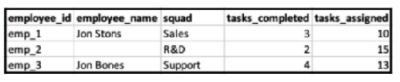
D)
Answer : C
In Marketing Cloud Intelligence, when linking two data streams, the parent data stream (File A) provides the main structure. Since 'Override Media Buy Hierarchies' is checked for File A, the hierarchies from File B will be aligned with File A. Given 'Data Updates Permissions' set for file B as 'Update Attributes and Hierarchy', this means that attributes and hierarchy will be updated in the parent file based on the child file (File B), but the child file's metrics won't be associated with the parent file's date.
Hence, when filtering on the entire date range (1-30/8), the resulting view will align with the structure of the parent data stream, showing the KPIs ('Tasks Completed' from File A and 'Tasks Assigned' from File B) alongside the employee names and squads from the respective files. Since the employee IDs align, the data can be linked properly. However, since the dates do not align (File A data is from 01/08/2019 and File B from 15/08/2019), only attributes from File B will be updated without date association.
The result will look like Option C, where the employee names are corrected based on File B's data, the squads are added from File B, and the tasks_completed and tasks_assigned are displayed from their respective files. The tasks_assigned from File B are shown without date association as File B's date doesn't match with File A's.
Question 4
Ina workspace that contains one hundred data streams and a lot of data, what is the biggest downside of using calculated dimensions?
Answer : A
In a workspace with a high number of data streams, such as one hundred, the biggest downside of using calculated dimensions is the performance impact. Calculated dimensions require computational resources to dynamically compute values based on existing data. This can lead to increased load times and slower performance, especially in environments with large amounts of data or complex calculations. This performance degradation is due to the extra processing power needed every time the data is accessed or refreshed, impacting the overall efficiency of data retrieval and analysis operations.
Question 5
Which two statements are correct regarding the Parent-Child configuration?
Answer : A, C
Parent-Child configurations in Marketing Cloud Intelligence are used to link different data tables based on shared key values, allowing for the relational organization of data across various streams. While this setup enhances data analysis and reporting by maintaining logical relationships between parent and child tables, it can also introduce performance issues. The complexity increases with the number of relationships and the volume of data, potentially slowing down query processing and data manipulation. Additionally, Parent-Child configurations facilitate the sharing of dimensions and measurements across linked tables, enhancing the data's usability without duplicating it.
Question 6
A technical architect is provided with the logic and Opportunity file shown below:
The opportunity status logic is as follows:
For the opportunity stages ''Interest'', ''Confirmed Interest'' and ''Registered'', the status should be ''Open''.
For the opportunity stage ''Closed'', the opportunity status should be closed.
Otherwise, return null for the opportunity status.

Given the above file and logic and assuming that the file is mapped in a GENERIC data stream type with the following mapping:
''Day'' --- Standard ''Day'' field
''Opportunity Key'' > Main Generic Entity Key
''Opportunity Stage'' --- Generic Entity Key 2
''Opportunity Count'' --- Generic Custom Metric
A pivot table was created to present the count of opportunities in each stage. The pivot table is filtered on Jan 7th - 10th. How many different stages are presented in the table?
Answer : C
Based on the Opportunity file and considering the filter dates from January 7th to 10th, the different stages presented are 'Interest', 'Confirmed Interest', and 'Registered'. This makes a total of 3 different stages that would be presented in the pivot table. Salesforce Marketing Cloud Intelligence allows for the creation of pivot tables that can display counts of entities across different dimensions, in this case, Opportunity Stages. Reference to Salesforce Marketing Cloud Intelligence documentation that covers data mapping and pivot table creation would support this conclusion.
Question 7
An implementation engineer is requested to apply the following logic:
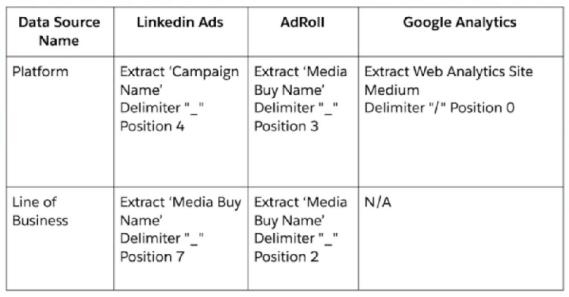
To apply the above logic, the engineer used only the Harmonization Center, without any mapping manipulations. What is the minimum amount of Patterns creating both 'Platform' and 'Line of Business'?"
Answer : B
To create both 'Platform' and 'Line of Business' fields using Patterns in the Harmonization Center without mapping manipulations, the engineer would need to create separate patterns for each data source mentioned. According to the provided images:
One pattern for LinkedIn Ads, to extract the 'Campaign Name' at position 4 for the Platform and 'Media Buy Name' at position 7 for Line of Business.
One pattern for AdRoll, to extract 'Media Buy Name' at position 3 for Platform and at position 2 for Line of Business.
One pattern for Google Analytics, which seems not required for the Platform but could apply if the Line of Business extraction is necessary, although it states N/A.
Hence, a minimum of 3 patterns would be necessary to create the fields required.