Page: 1
/ 14
Total 50 questions
Qlik QSDA2024 Qlik Sense Data Architect Certification Exam - 2024 Exam Practice Test
Question 1
Exhibit.

One of the data sources a data architect must add for a newly developed app is an Excel spreadsheet. The Region field only has values for the first record for the region. The data architect must perform a transformation so that each row contains the correct Region.
Which function should the data architect implement to resolve this issue?
Answer : A
The given Excel spreadsheet has a Region field where the region value is only specified for the first record within each region. The data architect needs to fill in the missing region values for subsequent rows.
Previous() Function: The Previous() function in Qlik Sense returns the value of the expression from the previous row. In this case, it can be used to fill down the Region values so that each row contains the correct region information.
Implementation: The script can be designed to check if the current row's Region value is missing (null). If it is missing, the script can assign the value from the previous row using the Previous() function.
LOAD
If(IsNull(Region), Previous(Region), Region) AS Region,
...
This logic fills in the missing Region values with the value from the preceding row, which effectively resolves the issue shown in the spreadsheet.
Question 2
Refer to the exhibit
A large transport company (Company A) acquires a smaller rival (Company B).
Company A has been using Qlik Sense tor 6 years to track revenue per ship journey. Ship journeys with no revenue (such as journeys to shipyards for repair) always show revenue of $0.
Company A wants to combine its data set with the data set of the acquired Company B. Company B's ship journey data shows $0 revenue in one of the following ways:
* A NULL value
* A value with one or more blank spaces (ASCII char code 32)
The data architect wants to conform the Company B data to the Company A standard, specifically regarding the use of an explicit $0 for journeys without revenue. Which script line should the data architect use?
A)

B)

C)

D)

Answer : A
In this scenario, the data architect needs to conform the revenue data from Company B to match the data standard of Company A, where $0 is explicitly used to represent journeys without revenue.
Explanation of the Correct Script:
Option A: money(replace(Revenue, chr(32), 0)) AS [Revenue Conformed]
replace(Revenue, chr(32), 0): This part of the expression replaces any spaces (ASCII character code 32) in the Revenue field with 0.
money(...): This function formats the resulting value as currency. Since Company B may have either null values or spaces where 0 should be, this script ensures that any blanks are replaced with 0 and then formatted as currency.
Why Option A is Correct:
Handling Spaces: The replace() function is effective in replacing spaces with 0, conforming to Company A's standard of using $0 for non-revenue journeys.
Handling NULL Values: The money() function is used to ensure the final output is formatted as currency. However, it's important to note that NULL values are not directly handled by the replace() function, which is why it is applied before money() to deal with spaces.
Question 3
A data architect needs to acquire social media data for the past 10 years. The data architect needs to track all changes made to the source data, include all relevant fields, and reload the application four times a day.
What information does the data architect need?
Answer : D
The scenario describes a need to track social media data over the past 10 years, capturing all changes (inserts, updates, deletes) while reloading the data four times a day.
To manage this:
ModificationTime: This field is essential for tracking changes over time. It indicates when a record was last modified, allowing the script to determine whether it needs to insert, update, or delete records.
Primary Key Field: A primary key is crucial for uniquely identifying records. It enables the script to match records in the source with those already loaded, facilitating updates and deletions.
Insert and Update Records: The script should handle both inserting new records and updating existing ones based on the ModificationTime.
Remove Records: If records are deleted in the source, they should also be removed in the Qlik Sense data model to maintain consistency.
This approach ensures that all changes in the social media data are accurately captured and reflected in the Qlik Sense application.
Question 4
Exhibit.
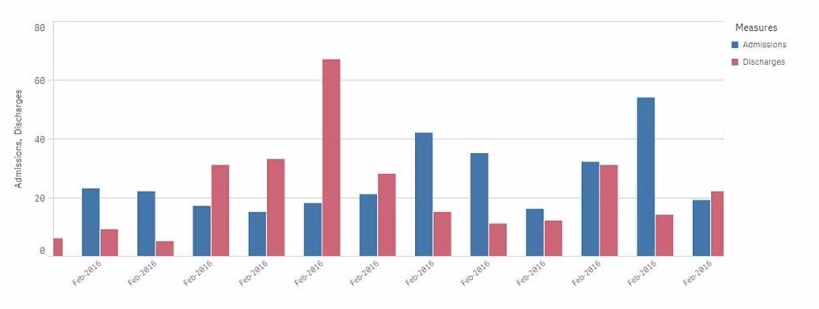
A chart for monthly hospital admissions and discharges incorrectly displays the month and year values on the x-axis.
The date format for the source data field "Common Date" is M/D/YYYY. This format was used in a calculated field named "Month-Year" in the data manager when the data model was first built.
Which expression should the data architect use to fix this issue?
Answer : A
The issue described relates to the incorrect display of month and year values on the x-axis of a chart. The source data has dates in the M/D/YYYY format, and a calculated field named Month-Year was created using this date format.
To correct the issue:
The correct approach is to use the MonthStart() function, which returns the first date of the month for the provided date. This ensures consistency in month-year representation.
The Date() function is then used to format the result of MonthStart() to the desired format of MMM-YYYY (e.g., Feb-2018).
Explanation of the Correct Expression:
MonthStart([Common Date]): This ensures that all dates within a month are treated as the first day of that month, which is critical for accurate monthly aggregation.
Date(..., 'MMM-YYYY'): This formats the result to show just the month and year in the correct format.
Using this expression ensures that the x-axis correctly displays the month-year values.
Question 5
A data architect needs to develop a script to export tables from a model based upon rules from an independent file. The structure of the text file with the export rules is as follows:
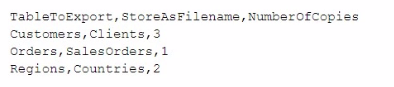
These rules govern which table in the model to export, what the target root filename should be, and the number of copies to export.
The TableToExport values are already verified to exist in the model.
In addition, the format will always be QVD, and the copies will be incrementally numbered.
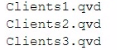
For example, the Customers table would be exported as:
What is the minimum set of scripting strategies the data architect must use?
Answer : A
In the provided scenario, the goal is to export tables from a Qlik Sense model based on rules specified in an external text file. The structure of the text file indicates which table to export, the filename to use, and how many copies to create.
Given this structure, the data architect needs to:
Loop through each row in the text file to process each table.
Use an IF statement to check whether the specified table exists in the model (though it's mentioned they are verified to exist, this step may involve conditional logic to ensure the rules are correctly followed).
Use another IF statement to handle the creation of multiple copies, ensuring each file is named incrementally (e.g., Clients1.qvd, Clients2.qvd, etc.).
Key Script Strategies:
Loop: A loop is necessary to iterate through each row of the text file to process the tables specified for export.
IF Statements: The first IF statement checks conditions such as whether the table should be exported (based on additional logic if needed). The second IF statement handles the creation of multiple copies by incrementing the filename.
This approach covers all the necessary logic with the minimum set of scripting strategies, ensuring that each table is exported according to the rules defined.
Question 6
A data architect needs to retrieve data from a REST API. The data architect needs to loop over a series of items that are being read using the REST connection.
What should the data architect do?
Answer : B
When retrieving data from a REST API, particularly when the dataset is large or the data is segmented across multiple pages (which is common in REST APIs), the REST Connector in Qlik Sense needs to be configured to handle pagination.
Pagination is the process of dividing the data retrieved from the API into pages that can be loaded sequentially or as required. Qlik Sense's REST Connector supports pagination by allowing the data architect to set parameters that will sequentially retrieve each page of data, ensuring that the complete dataset is retrieved.
Key Steps:
REST Connector Setup: Configure the REST connector in Qlik Sense and specify the necessary API endpoint.
Pagination Mechanism: Use the built-in pagination mechanism to define how the connector should retrieve the subsequent pages (e.g., by using query parameters like page or offset).
Question 7
Refer to the exhibit.
Refer to the exhibit.
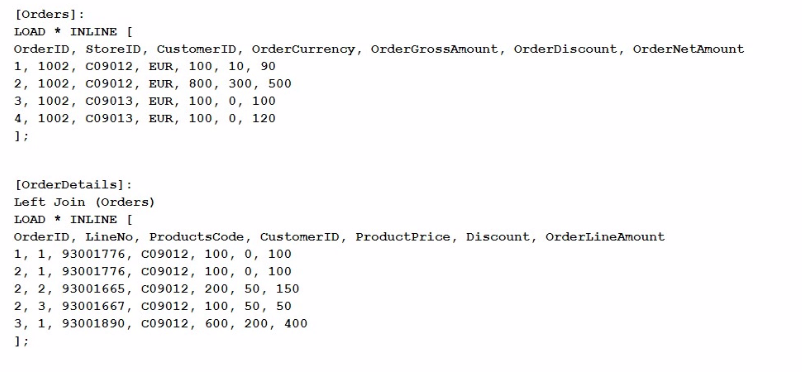
What does the expression sum< [orderMetAmount ]) return when all values in LineNo are selected?
Answer : B
The expression sum([OrderNetAmount]) sums the values in the OrderNetAmount field across the dataset. Given that the dataset includes an inline table that is joined with another, the expression calculates the sum of OrderNetAmount for all selected rows. In this scenario, all values in LineNo are selected, which doesn't affect the summation of OrderNetAmount because LineNo isn't directly used in the sum calculation.
Step-by-step Calculation:
The Orders table contains the OrderNetAmount for each order. The values provided are 90, 500, 100, and 120.
Adding these values together: 90+500+100+120=81090 + 500 + 100 + 120 = 81090+500+100+120=810
However, after the Left Join operation with the OrderDetails table, some of these rows might be duplicated if the join results in multiple matches. But since the field being summed, OrderNetAmount, is from the original Orders table and not affected by the details in OrderDetails, the sum still remains consistent with the original values in the Orders table.
Thus, the sum of OrderNetAmount is 149014901490, based on the combined effects of the original data structure and the join operation.