Page: 1
/ 14
Total 373 questions
Microsoft PL-300 Microsoft Power BI Data Analyst Exam Practice Test
Question 1
You use Power BI Desktop to open a PBIX file that contains a Microsoft Excel data source.
You attempt to refresh the data and receive the following error message.
Expression.Error: The Colum 'cost' of the table wasn't found.
What is a possible cause of the error?
Answer : A
Question 2
You have a Power BI semantic model named Model1 that contains two table named DimDate and FactSales. There is an active relationship between DimDate and FactSales. DimDate is marked as the date table. FactSales contains the following data.
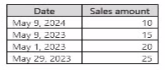
Model1 contains the following measure:

You have a report that uses Model1. The report has a single report page that has a page level filter set to may 9, 2024. The result of the Previous Year measure is displayed in a card visual.
Which value appear in the card visual?
Answer : B
Question 3
You have a Power BI semantic model that contains a table named Table1. Table1 contains the following columns:
* WebsiteName
* URL
You need to create a report named Report1 that will contain a table visual. The solution must meet the following requirements.
* Display the website name
* Enable users to navigate to the website's URL by selecting the website name.
What should you use?
Answer : B
Question 4
You have a Power B1 semantic model named Model 1 that runs in import storage node.
You need to reduce the size of Model.
Which two action should you perform? Each connect answer presents a complete solution.
NOTE: Each correct selection is worth one point.
Answer : A, C
Question 5
You have a Power Bl report that contains a table visual The visual contains a column.
The column contains whole numbers ranging from o* 1 to 20.
You need to use conditional formatting to meet the following requirements:
* Visually compare the values without having to read the text containing the number.
* Show a different format for each distinct value
* Hide the numeric value of ColumnA.
* Minimize development effort.
Which formatting should you use?
Answer : D
Question 6
You have a Microsoft SharePoint Online site that contains several document libraries.
One of the document libraries contains manufactunng reports saved as Microsoft Excel files. All the manufacturing reports have the same data structure.
You need to use Power Bl Desktop to load only the manufacturing reports to a table for analysis.
What should you do?
Answer : D
Question 7
You have a CSV file that contains user complaints. The file contains a column named Logged. Logged contains the date and time each compliant occurred. The data in Logged is in the fol-lowing format: 2018-12-31 at 08:59. You need to be able to analyze the complaints by the logged date and use a built-in date hierarchy. What should you do?
Answer : C
Logged
2018-12-31 at 08:59
2019-01-01 at 09:15
Logged
Date
2018-12-31 at 08:59
2018-12-31
2019-01-01 at 09:15
2019-01-01
This makes it possible to use a built-in date hierarchy for analysis.