Page: 1
/ 14
Total 117 questions
Microsoft DP-600 Implementing Analytics Solutions Using Microsoft Fabric Exam Practice Test
Question 1
Note: This section contains one or more sets of questions with the same scenario and problem. Each question presents a unique solution to the problem. You must determine whether the solution meets the stated goals. More than one solution in the set might solve the problem. It is also possible that none of the solutions in the set solve the problem.
After you answer a question in this section, you will NOT be able to return. As a result, these questions do not appear on the Review Screen.
Your network contains an on-premises Active Directory Domain Services (AD DS) domain named contoso.com that syncs with a Microsoft Entra tenant by using Microsoft Entra Connect.
You have a Fabric tenant that contains a semantic model.
You enable dynamic row-level security (RLS) for the model and deploy the model to the Fabric service.
You query a measure that includes the username () function, and the query returns a blank result.
You need to ensure that the measure returns the user principal name (UPN) of a user.
Solution: You update the measure to use the USEROBJECT () function.
Does this meet the goal?
Answer : B
Question 2
You have a Fabric tenant that contains customer churn data stored as Parquet files in OneLake. The data contains details about customer demographics and product usage.
You create a Fabric notebook to read the data into a Spark DataFrame. You then create column charts in the notebook that show the distribution of retained customers as compared to lost customers based on geography, the number of products purchased, age. and customer tenure.
Which type of analytics are you performing?
Answer : C
Question 3
You have a Fabric tenant that contains a Microsoft Power Bl report.
You are exploring a new semantic model.
You need to display the following column statistics:
* Count
* Average
* Null count
* Distinct count
* Standard deviation
Which Power Query function should you run?
Answer : B
The Table.Profile function in Power Query is used to generate column statistics such as count, average, null count, distinct count, and standard deviation. You can use this function as follows:
Invoke the Power Query Editor.
Apply the Table.Profile function to your table.
The result will be a table where each row represents a column from the original table, and each column in the result represents a different statistic such as those listed in the requirement.
Question 4
You have a Microsoft Fabric tenant that contains a dataflow.
You are exploring a new semantic model.
From Power Query, you need to view column information as shown in the following exhibit.
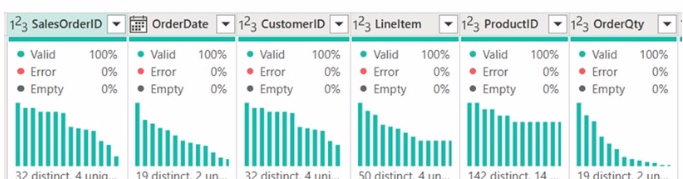
Which three Data view options should you select? Each correct answer presents part of the solution. NOTE: Each correct answer is worth one point.
Answer : A, B, D
To view column information like the one shown in the exhibit in Power Query, you need to select the options that enable profiling and display quality and distribution details. These are: A. Enable column profile - This option turns on profiling for each column, showing statistics such as distinct and unique values. B. Show column quality details - It displays the column quality bar on top of each column showing the percentage of valid, error, and empty values. E. Show column value distribution - It enables the histogram display of value distribution for each column, which visualizes how often each value occurs.
Question 5
You have an Azure Repos Git repository named Repo1 and a Fabric-enabled Microsoft Power Bl Premium capacity. The capacity contains two workspaces named Workspace! and Workspace2. Git integration is enabled at the workspace level.
You plan to use Microsoft Power Bl Desktop and Workspace! to make version-controlled changes to a semantic model stored in Repo1. The changes will be built and deployed lo Workspace2 by using Azure Pipelines.
You need to ensure that report and semantic model definitions are saved as individual text files in a folder hierarchy. The solution must minimize development and maintenance effort.
In which file format should you save the changes?
Answer : C
When working with Power BI Desktop and Git integration for version control, report and semantic model definitions should be saved in the PBIX format. PBIX is the Power BI Desktop file format that contains definitions for reports, data models, and queries, and it can be easily saved and tracked in a version-controlled environment. The solution should minimize development and maintenance effort, and saving in PBIX format allows for the easiest transition from development to deployment, especially when using Azure Pipelines for CI/CD (continuous integration/continuous deployment) practices.
Question 6
You have a Fabric tenant that contains a lakehouse named lakehouse1. Lakehouse1 contains a table named Table1.
You are creating a new data pipeline.
You plan to copy external data to Table1. The schema of the external data changes regularly.
You need the copy operation to meet the following requirements:
* Replace Table1 with the schema of the external data.
* Replace all the data in Table1 with the rows in the external data.
You add a Copy data activity to the pipeline. What should you do for the Copy data activity?
Answer : B
For the Copy data activity, from the Destination tab, setting Table action to Overwrite (B) will ensure that Table1 is replaced with the schema and rows of the external data, meeting the requirements of replacing both the schema and data of the destination table. Reference = Information about Copy data activity and table actions in Azure Data Factory, which can be applied to data pipelines in Fabric, is available in the Azure Data Factory documentation.
Question 7
You have a Fabric tenant that contains a semantic model.
You need to prevent report creators from populating visuals by using implicit measures.
What are two tools that you can use to achieve the goal? Each correct answer presents a complete solution.
NOTE: Each correct answer is worth one point.
Answer : A, B
Microsoft Power BI Desktop (A) and Tabular Editor (B) are the tools you can use to prevent report creators from using implicit measures. In Power BI Desktop, you can define explicit measures which can be used in visuals. Tabular Editor allows for advanced model editing, where you can enforce the use of explicit measures. Reference = Guidance on using explicit measures and preventing implicit measures in reports can be found in the Power BI and Tabular Editor official documentation.