Page: 1
/ 14
Total 464 questions
Microsoft Power BI Data Analyst PL-300 Exam Questions
Question 1
You have a Power B1 report that contains three pages named Page1, Page2, and Page3. All the pages have the same slicers. You need to ensure that all the filters applied to Page1 apply to Page1 and Page3 only. What should you do?
Answer : A
Question 2
You need to create a Power Bl theme that will be used in multiple reports. The theme will include corporate branding for font size, color, and bar chart formatting.
What should you do?
Answer : D
Question 3
Note: This question is part of a series of questions that present the same scenario. Each question in the series contains a unique solution that might meet the stated goals. Some question sets might have more than one correct solution, while others might not have a correct solution.
After you answer a question in this section, you will NOT be able to return to it. As a result, these questions will not appear in the review screen.
You are modeling data by using Microsoft Power BI. Part of the data model is a large Microsoft SQL Server table named Order that has more than 100 million records.
During the development process, you need to import a sample of the data from the Order table.
Solution: You add a WHERE clause to the SQL statement.
Does this meet the goal?
Answer : A
The WHERE clause has its effects before the data is imported.
https://docs.microsoft.com/en-us/power-bi/connect-data/service-gateway-sql-tutorial
Question 4
Note: This question is part of a series of questions that use the same scenario. For your convenience, the scenario is repeated in each question. Each question presents a different goal and answer choices, but the text of the scenario is the same in each question in this series.
You have a Microsoft SQL Server database that contains the following tables.
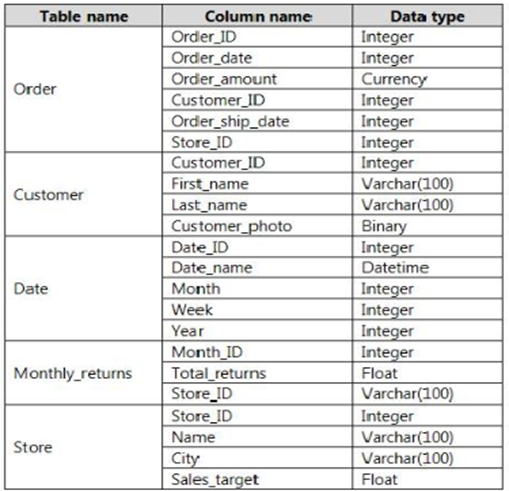
The following columns contain date information:
- Date[Month] in the mmyyyy format
- Date[Date_ID] in the ddmmyyyy format
- Date[Date_name] in the mm/dd/yyyy format
- Monthly_returns[Month_ID] in the mmyyyy format
The Order table contains more than one million rows.
The Store table has a relationship to the Monthly_returns table on the Store_ID column. This is the only relationship between the tables.
You plan to use Power BI Desktop to create an analytics solution for the data.
You need to create a relationship between the Monthly_returns table and Date[Date_ID].
What should you do before you create the relationship?
Question 5
What is the minimum number of Power BI datasets needed to support the reports?
Answer : A
Question 6
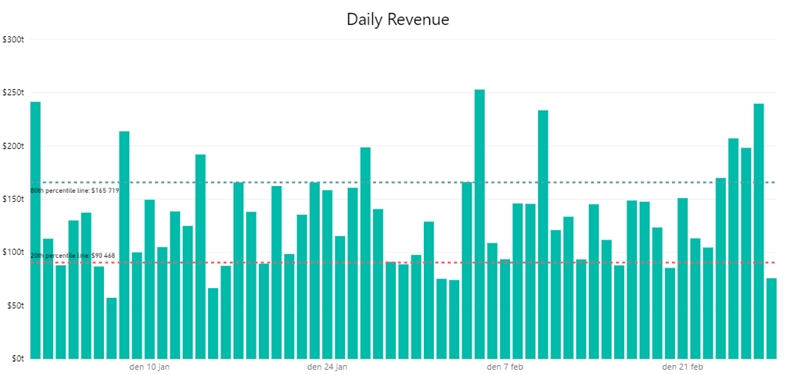
You plan to create the chart shown in the following exhibit.
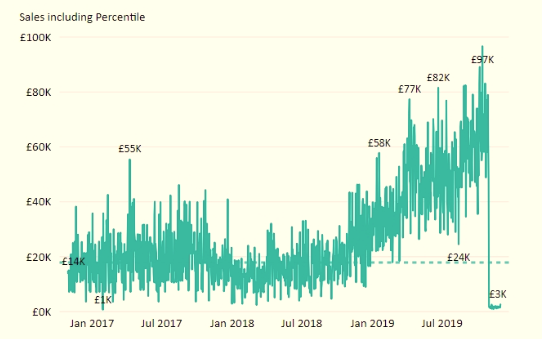
How should you create the dashed horizontal line denoting the 40th percentile of daily sales for the period shown?
Answer : C
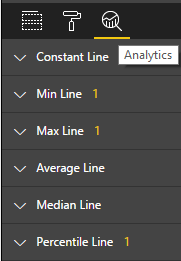
The analytics feature enables you to show percentiles across groups specified along a specific axis.
Example:
1. Click on the analytics tab
2. Select Percentile
3. You can choose a specific percentile along with other formatting options.
4. Drag a date or non-numeric dimension into the Axis of a column chart
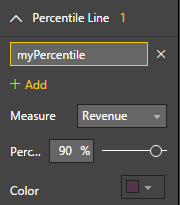
Add percentile lines to monitor daily revenue
Question 7
You need to create the dataset. Which dataset mode should you use?
Answer : D
Composite Model means now you can have a model, that very large tables of that are coming from the DirectQuery connection, without the need for importing, and small tables to be imported to be accessible quickly.