Page: 1
/ 14
Total 63 questions
Fortinet NSE5_FSM-6.3 Fortinet NSE 5 - FortiSIEM 6.3 Exam Practice Test
Question 1
Refer to the exhibits.
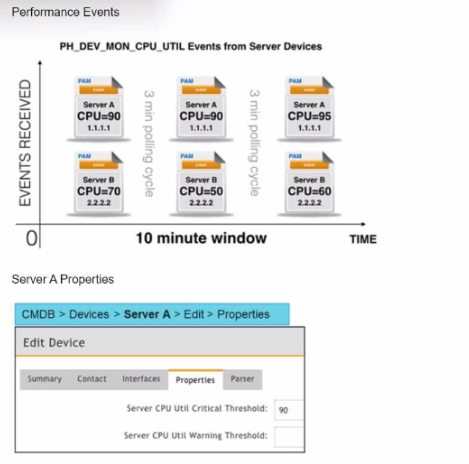
Three events are collected over a 10-minute time period from two servers: Server A and Server B.
Based on the settings tor the rule subpattern. how many incidents will the servers generate?
Answer : D
Event Collection Overview: The exhibits show three events collected over a 10-minute period from two servers, Server A and Server B.
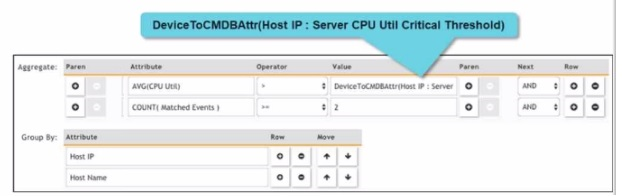
Rule Subpattern Settings: The rule subpattern specifies two conditions:
AVG(CPU Util) > DeviceToCMDBAttr(Host IP : Server CPU Util Critical Threshold): This checks if the average CPU utilization exceeds the critical threshold defined for each server.
COUNT(Matched Events) >= 2: This requires at least two matching events within the specified period.
Server A Analysis:
Events: Three events (CPU=90, CPU=90, CPU=95).
Average CPU Utilization: (90+90+95)/3 = 91.67, which exceeds the critical threshold of 90.
Matched Events Count: 3, which meets the condition of being greater than or equal to 2.
Incident Generation: Server A meets both conditions, so it generates one incident.
Server B Analysis:
Events: Three events (CPU=70, CPU=50, CPU=60).
Average CPU Utilization: (70+50+60)/3 = 60, which does not exceed the critical threshold of 90.
Matched Events Count: 3, but since the average CPU utilization condition is not met, no incident is generated.
Conclusion: Based on the rule subpattern, Server A will generate one incident, and Server B will not generate any incidents.
Reference: FortiSIEM 6.3 User Guide, Event Correlation Rules and Incident Management sections, which explain how incidents are generated based on rule subpatterns and event conditions.
Question 2
In which state can a device be moved into the CMDB to prevent monitoring log collection?
Answer : A
Question 3
Refer to the exhibit.
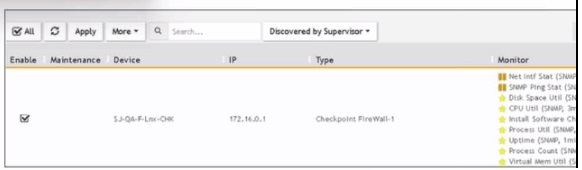
What does the pauso icon indicate?
Answer : D
Data Collection Status: FortiSIEM displays various icons to indicate the status of data collection for different devices.
Pause Icon: The pause icon specifically indicates that data collection is paused, but this can happen due to several reasons.
Common Cause for Pausing: One common cause for pausing data collection is an issue such as a change of password, which prevents the system from authenticating and collecting data.
Exhibit Analysis: In the provided exhibit, the presence of the pause icon next to the device suggests that data collection has encountered an issue that has caused it to pause.
Reference: FortiSIEM 6.3 User Guide, Device Management and Data Collection Status Icons section, which explains the different icons and their meanings.
Question 4
Refer to the exhibit.
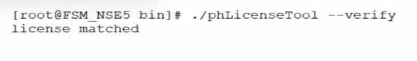
The output shows that the license is in which condition?
Answer : B
Question 5
In me FortiSIEM CLI. which command must you use to determine whether or not syslog is being received from a network device?
Answer : A
Syslog Reception Verification: To verify whether syslog messages are being received from a network device, a network packet capture tool can be used.
tcpdump Command: tcpdump is a powerful command-line packet analyzer tool available in Unix-like operating systems. It allows administrators to capture and analyze network traffic.
Usage: By using tcpdump with the appropriate filters (e.g., port 514 for syslog), administrators can monitor the incoming syslog messages in real-time to verify if they are being received.
Example Command: tcpdump -i <interface> port 514 captures the syslog messages on the specified network interface.
Reference: FortiSIEM 6.3 User Guide, CLI Commands section, which details the usage of tcpdump for network traffic analysis and verification of syslog reception.
Question 6
Where must you configure rule notifications and automated remediation on FortiSIEM?
Answer : B
Question 7
Refer to the exhibit.

Which section contains the subpattren configuration settings that determine how many matching events are needed to trigger the rule?
Answer : B