Page: 1
/ 14
Total 56 questions
Fortinet FCP - FortiAnalyzer 7.4 Analyst FCP_FAZ_AN-7.4 Exam Practice Test
Question 1
A playbook contains five tasks in total. An administrator runs the playbook and four out of five tasks finish successfully, but one task fails.
What will be the status of the playbook after it is run?
Answer : A
In FortiAnalyzer, when a playbook is run, each task's status impacts the overall playbook status. Here's what happens based on task outcomes:
Status When All Tasks Succeed:
If all tasks finish successfully, the playbook status is marked as Success.
Status When Some Tasks Fail:
If one or more tasks in the playbook fail, but others succeed, the playbook status generally changes to Attention required. This status indicates that the playbook completed execution but requires review due to one or more tasks failing.
This is different from a complete Failed status, which is used if the playbook cannot proceed due to a critical error in an early task, often one that upstream tasks depend on.
Option Analysis:
A . Attention required: This is correct as the playbook has completed, but with partial success and a task requiring review.
B . Upstream_failed: This status is used if a task cannot run because a prerequisite or 'upstream' task failed. Since four out of five tasks completed, this is not the case here.
C . Failed: This status would imply that the playbook completely failed, which does not match the scenario where only one task out of five failed.
D . Success: This status would apply if all tasks had completed successfully, which is not the case here.
Conclusion:
Correct Answe r : A. Attention required
The playbook status reflects that it completed, but an error occurred in one of the tasks, prompting the administrator to review the failed task.
FortiAnalyzer 7.4.1 documentation on playbook execution statuses and task error handling.
Question 2
Why must you wait for several minutes before you run a playbook that you just created?
Answer : A
When a new playbook is created on FortiAnalyzer, the system requires some time to parse and validate the playbook before it can be executed. Parsing involves checking the playbook's structure, ensuring that all syntax and logic are correct, and preparing the playbook for execution within FortiAnalyzer's automation engine. This initial parsing step is necessary for FortiAnalyzer to load the playbook into its operational environment correctly.
Here's why the other options are incorrect:
Option A: FortiAnalyzer needs that time to parse the new playbook
This is correct. The delay is due to the parsing and setup process required to prepare the new playbook for execution. FortiAnalyzer's automation engine checks for any issues or dependencies within the playbook, ensuring that it can run without errors.
Option B: FortiAnalyzer needs that time to debug the new playbook
This is incorrect. Debugging is not an automatic process that FortiAnalyzer undertakes after playbook creation. Debugging, if necessary, is a manual task performed by the administrator if there are issues with the playbook execution.
Option C: FortiAnalyzer needs that time to back up the current playbooks
This is incorrect. FortiAnalyzer does not automatically back up playbooks every time a new one is created. Backups of configuration and playbooks are typically scheduled as part of routine maintenance and are not triggered by playbook creation.
Option D: FortiAnalyzer needs that time to ensure there are no other playbooks running
This is incorrect. FortiAnalyzer can manage multiple playbooks running simultaneously, so it does not require waiting for other playbooks to finish before initiating a new one. The waiting time specifically relates to the parsing process of the newly created playbook.
Question 3
Which log will generate an event with the status Contained?
Answer : A
Question 4
Which two methods can you use to send notifications when an event occurs that matches a configured event handler? (Choose two.)
Answer : B, C
In FortiAnalyzer, event handlers can be configured to trigger specific notifications when an event matches defined criteria. These notifications are designed to alert administrators in real time about critical events.
Option B - Send SNMP Trap:
FortiAnalyzer supports sending SNMP traps as one of the notification methods when an event matches an event handler. This allows integration with SNMP-enabled network management systems, which can then trigger further alerts or actions based on the trap received.
Conclusion: Correct.
Option C - Send SMS Notification:
FortiAnalyzer also supports SMS notifications, enabling alerts to be sent via SMS to predefined recipients. This method is useful for administrators who require immediate alerts but may not have access to email or other notification systems at all times.
Conclusion: Correct.
Option A - Send Alert through Fabric Connectors:
While Fabric Connectors allow FortiAnalyzer to interact with other parts of the Security Fabric, they are primarily used for data sharing and automation rather than directly for sending alerts or notifications.
Conclusion: Incorrect.
Option D - Send Alert through FortiSIEM MEA:
FortiSIEM integration allows for data sharing and further analysis within the Fortinet ecosystem, but it does not directly act as a notification method from FortiAnalyzer itself.
Conclusion: Incorrect.
Conclusion:
Correct Answe r : B. Send SNMP trap and C. Send SMS notification
These options represent valid notification methods for FortiAnalyzer's event handler configuration.
FortiAnalyzer 7.4.1 documentation on event handler configuration and available notification methods.
Question 5
Which statement about sending notifications with incident updates is true?
Answer : A
Question 6
Exhibit.
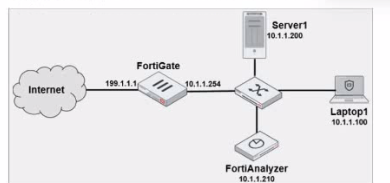
Laptop1 is used by several administrators to manage FotiAnalyzer. You want to configure a generic text filter that matches all login attempts to the web interface generated by any user other than admin'', and coming from Laptop1.
Which filter will achieve the desired result?
Answer : A
The objective is to create a filter that identifies all login attempts to the FortiAnalyzer web interface (GUI) coming from Laptop1 (IP 10.1.1.100) and excludes the admin user. This filter should match any user other than admin.
Filter Components Analysis:
Operation-login: This portion of the filter will target login actions specifically, which is correct for filtering login attempts.
performed_on==''GUI(10.1.1.100)': This indicates that the login attempt must occur on the GUI interface and originate from the specified IP, which matches Laptop1's IP address (10.1.1.100). This ensures that the filter only matches GUI logins from this specific device.
user!=admin: This part excludes logins by the admin user, meeting the requirement to capture only non-admin users.
Option Analysis:
Option A: Correctly specifies the Operation-login, performed_on==''GUI(10.1.1.100)', and user!=admin. This setup effectively filters login attempts to the GUI from Laptop1, excluding the admin user.
Option B: Uses the incorrect IP 10.1.1.120 in the performed_on filter, which does not match Laptop1's IP (10.1.1.100).
Option C: This option includes srcip==10.1.1.100 and dstip==10.1.1.210 but incorrectly specifies user==admin instead of user!=admin, which does not match the requirement to exclude admin users.
Option D: This option does not specify the performed_on field to restrict it to the GUI and only includes dstip (destination IP) without srcip. It also incorrectly uses user!-admin instead of the correct syntax user!=admin.
Conclusion:
Correct Answe r : A. Operation-login and performed_on==''GUI(10.1.1.100)' and user!=admin
This filter precisely captures the required conditions: login attempts from Laptop1 to the GUI interface by any user except admin.
FortiAnalyzer 7.4.1 documentation on log filters, syntax for login operations, and GUI login tracking.
Question 7
You discover that a few reports are taking a long tine lo generate. Which two steps can you Like to troubleshoot? (Choose two.)
Answer : A, B