Page: 1
/ 14
Total 715 questions
CFA Institute CFA Level II Chartered Financial Analyst CFA-Level-II Exam Practice Test
Question 1
Jason Bennett is an analyst for Valley Airlines (Valley), a U .S . firm. Valley owns a stake in Southwest Air Cargo (Southwest), also a U .S . firm. The two firms have had a long-standing relationship. The relationship has become even closer because several of Valley's top executives hold seats on Southwest's Board of Directors.
Valley acquired a 45% ownership stake in Southwest on December 31, 2007. Acquisition of the ownership stake cost $9 million and was paid in cash. Valley's stake in Southwest is such that management can account for the investment using either the equity method or the acquisition method. While Valley's management desires to fairly represent the firm's operating results, they have assigned Bennett to assess the impact of each method on reported financial statements.
Immediately prior to the acquisition. Valley's current asset balance and total equity were $96 million and $80 million, respectively. Southwest's current assets and total equity were $32 million and $16 million, respectively.
While analyzing the use of the equity method versus the acquisition method, Bennett calculates the return on assets (ROA) ratio. He arrives at two conclusions:
Statement 1: Compared to the acquisition method, the equity method results in a higher ROA because of the higher net income under the equity method.
Statement 2: Compared to the acquisition method, the equity method results in a higher ROA because of the smaller level of total assets under the equity method.
In order to get a better picture of Valley's operating condition, Bennett is also considering the use of proportionate consolidation to account for Southwest. He makes the following statements regarding the acquisition method and a proportionate consolidation:
Statement 3: Both methods are widely accepted under the provisions of U .S . GAAP and International Financial Reporting Standards (IFRS).
Statement 4: Both methods report the same level of assets on the parent's balance sheet.
Statement 5: Both methods report all of Southwest's liabilities on the parent's balance sheet.
In addition. Valley has always wanted to pursue its goal of vertical integration by expanding its scope of operations to include the manufacturing of airline parts for its own airplanes. Therefore, it established a subsidiary, Mountain Air Parts (Mountain), in Switzerland on January 1,2008. Switzerland was chosen as the location for economic and geographical diversification reasons. Mountain will operate as a self-contained, independent subsidiary. Local management in Switzerland will make the majority of operating, financing, and investing decisions.
The Swiss franc (CHF) is the official currency in Switzerland. On January 1, 2008, the USD/CHF exchange rate was 0.77. At December 31, 2008, the exchange rate had changed to 0.85 USD/CHF. The average exchange rate in 2008 was 0.80 USD/CHF. In its first year of operations. Mountain paid no dividends and no taxes. Mountain uses the FIFO assumption for its flow of inventory.
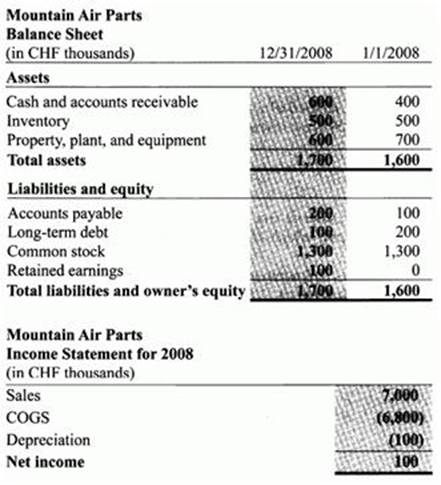
For this question only, assume that Mountain is operating in a highly inflationary environment. Which of the following statements is least correct? Mountain's:
Answer : A
Question 2
Amie Lear, CFA, is a quantitative analyst employed by a brokerage firm. She has been assigned by her supervisor to cover a number of different equity and debt investments. One of the investments is Taylor, Inc. (Taylor), a manufacturer of a wide range of children's toys. Based on her extensive analysis, she determines that her expected return on the stock, given Taylor's risks, is 10%. In applying the capital asset pricing model (CAPM), the result is a 12% rate of return.
For her analysis of the returns of Devon, Inc. (Devon), a manufacturer of high-end sports apparel, Lear intends to use the Fama-French model (FFM). Devon is a small-cap growth stock that has traded at a low market-to-book value in recent years. Lear's analysis has provided a wealth of quantitative information to consider. The return on a value-weighted market index minus the risk-free rate is 5.5%, the small-cap return premium is 3.1%, the value return premium is 2.2%, and the liquidity premium is 3.3%. The risk-free rate is 3.4%. The market, size, relative value, and liquidity betas for Devon are 0.7, -0.3, 1.4, and 1.2, respectively. In estimating the appropriate equity risk premium, Lear has chosen to use the Gordon growth model.
Lear's assistant, Doug Saunders, presents her with a report on macroeconomic multifactor models that includes the following two statements:
Statement 1: Business cycle risk represents the unexpected change in the difference between the return of risky corporate bonds and government bonds.
Statement 2: Confidence risk represents the unexpected change in the level of real business activity.
Lear is also attempting to determine the most appropriate method for determining the required return for Densmore, Inc. (Densmore), a closely held company that is considering a debt issue within the next year. The company has not previously issued debt securities to the public, relying instead on bank financing. She realizes that there are a number of models to consider, including the CAPM, multifactor models, and build-up models.
Lear's choice of the Gordon growth model is an example of which of the following types of estimates of the equity risk premium?
Answer : B
The Gordon growth model is a popular method to generate forward-looking estimates using current information and expectations concerning economic and financial variables.
A historical estimate of the equity risk premium consists of the difference between the historical mean return for a broad-based equity market index and a risk-free rate over a given time period.
A macroeconomic model estimate of the equity risk premium is based on the relationships between macroeconomic variables and financial variables. (Study Session 10, LOS 35.b, c, d)
Question 3
High Plains Tubular Company is a leading manufacturer and distributor of quality steel products used in energy, industrial, and automotive applications worldwide.
The U .S . steel industry has been challenged by competition from foreign producers located primarily in Asia. All of the U .S . producers are experiencing declining margins as labor costs continue to increase. In addition, the U .S . steel mills arc technologically inferior to the foreign competitors. Also, the U .S . producers have significant environmental issues that remain unresolved.
High Plains is not immune from the problems of the industry and is currently in technical default under its bond covenants. The default is a result of the failure to meet certain coverage and turnover ratios. Earlier this year, High Plains and its bondholders entered into an agreement that will allow High Plains time to become compliant with the covenants. If High Plains is not in compliance by year end, the bondholders can immediately accelerate the maturity date of the bonds. In this case. High Plains would have no choice but to file bankruptcy.
High Plains follows U .S . GAAP. For the year ended 2008, High Plains received an unqualified opinion from its independent auditor. However, the auditor's opinion included an explanatory paragraph about High Plains' inability to continue as a going concern in the event its bonds remain in technical default.
At the end of 2008, High Plains' Chief Executive Officer (CEO) and Chief Financial Officer (CFO) filed the necessary certifications required by the Securities and Exchange Commission (SEC).
To get a better understanding of High Plains' financial situation, it is helpful to review High Plains' cash flow statement found in Exhibit 1 and selected financial footnotes found in Exhibit 2.
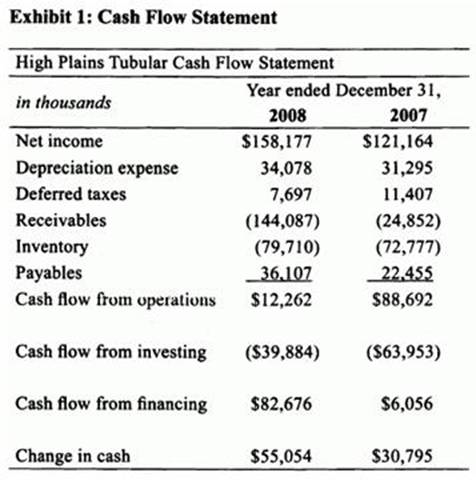
Exhibit 2: Selected Financial Footnotes
1. During 2008, High Plains' sales increased 27% over 2007. Its sales growth continues to significantly exceed the industry average. Sales are recognized when a firm order is received from the customer, the sales price is fixed and determinable, and collectability is reasonably assured.
2. The cost of inventories is determined using the last-in, first-out (LIFO) method. Had the first-in, first-out method been used, inventories would have been $152 million and $143 million higher as of December 31,2008 and 2007, respectively.
3. Effective January 1, 2008, High Plains changed its depreciation method from the double-declining balance method to the straight-line method in order to be more comparable with the accounting practices of other firms within its industry. The change was not retroactively applied and only affects assets that were acquired on or after January 1,2008.
4. High Plains made the following discretionary expenditures for maintenance and repair of plant and equipment and for advertising and marketing:
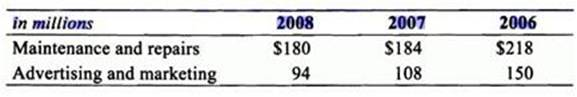
5. During the fiscal year ended December 31, 2008, High Plains sold $50 million of its accounts receivable, with recourse, to an unrelated entity. All of the receivables were still outstanding at year end.
6. High Plains conducts some of its operations in facilities leased under noncancelable capital leases. Certain leases include renewal options with provisions for increased lease payments during the renewal term.
7. High Plains' average net operating assets at the end of 2008 and 2007 was $977.89 million and $642.83 million, respectively.
Which of the following statements about evaluating High Plains financial reporting quality is least accurate?
Answer : C
It appears thai High Plains manipulated its earnings upward in 2008 to avoid default under its bond covenants. However, the higher earnings are lower quality as measured by the cash flow accrual ratio. Because of the estimates involved, a lower weighting should be assigned to the accrual component of High Plains' earnings. Extreme earnings (including revenues) tend to revert to normal levels over time (mean reversion). (Study Session 7, LOS 25.b,e)
Question 4
Austin Clark, CFA, has been asked to analyze White Goods Corporation, a $9 billion company that owns a nationwide chain of stores selling appliances and other electronic goods. As part of his analysis of the White Goods Corporation, Clark's supervisor, David Horvath, asks Clark to forecast White Goods' 2009 sales using multiple regression analysis. The following model was developed:
sales = 20.1 + 0.001 GDP+ 1,000.6 TR + 0.1 CC -3.2 PC -40.3 UR
t-values: (1.1) (2.3) (1.75) (3.2) (-0.48) (-0.9)
Number of observations: 76
Standard error estimate: 15.67
Unadjusted R2: 0.96
Regression sum of squares: 412,522
Error sum of squares: 17,188
Independent Variable Descriptions
GDP = gross domestic product
TR = average coupon rate on 5-year U .S . Treasury securities
CC = most recent quarter end consumer confidence index value
PC = previous year's sales of personal computers
UR = most recent quarter end unemployment rate
Variable Estimates for 2009
GDP =8,000
TR = 0.05
CC =97
PC = 60,000
UR = 0.055
Critical Values For Student's t-Distribution
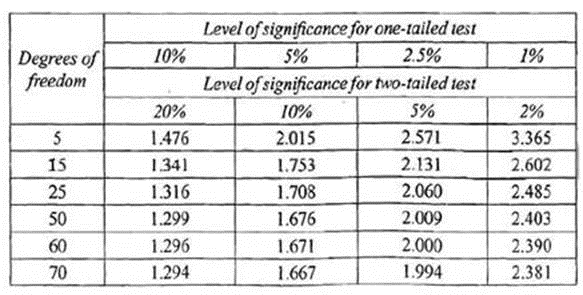
Clark's supervisor asks him to prepare a report explaining the implications of the regression analysis results. Clark writes the following conclusions concerning regression analysis in his report:
Interpreting the results of regression analysis can be problematic if certain assumptions of the ordinary least squares framework are violated. The regression output for White Goods Corporation is unreliable for the following reasons:
Finding 1: The correlation between regression errors across time is very close to 1.
Finding 2: There is a strong relationship between the regression error variance and the regression independent variables.
Clark's two documented findings related to his examination of the regression errors should lead to the conclusion that Clark's regression equation exhibits strong evidence of:
Answer : A
A regression exhibits conditional heteroskedasticity if the variance of the regression errors are not constant and are related to the regression independent variables. Clark's Finding 2 indicates that his regression exhibits conditional heteroskedasticity. (Study Session 3> LOS 12.g)
Question 5
Michael Thomas, CFA, is a fixed-income portfolio manager for TFC Investments. As part of his portfolio strategy for the Prosperity Fund, Thomas searches for companies that he expects to be upgraded or downgraded. Those potential upgrades he finds are added to the portfolio or if already in the portfolio are increased in proportion to other holdings before the upgrade takes place. Potential downgrades are sold from the portfolio before the downgrade takes place. Thomas is evaluating his portfolio's current holdings which include several bonds issued by companies in the oil and gas exploration and refining industries. Year-end rating updates are expected to occur in a few days and Thomas is preparing to adjust his portfolio based on expected changes in credit ratings. He has assembled the following annual data on four of the oil and gas stocks in the portfolio:
Exhibit: 1
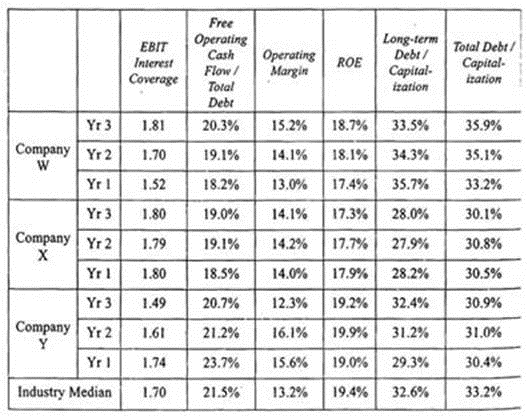
Thomas has been discussing his fixed-income strategies with a fellow portfolio manager, Shawna Reese. Reese has indicated that while his initial approach is good, the overall credit analysis strategy could be improved and has made the following suggestions to Thomas for both the Prosperity Fund and other fixed-income funds he manages:
* The current methodology does not consider special issues related to high-yield debt which makes up approximately 5% of the Prosperity Fund. Because most high-yield issuers have such a heavy dependence on short-term debt financing, analysis of the firm's debt structure will be extremely important to determine the priority of claims on the firm's assets as well as what source(s) of funds will be used to repay the principal. In addition, the corporate structure of high-yield issuers must be examined to determine the issuer's access to cash flows generated by its subsidiaries. A simple analysis of the parent's financial ratios will not reveal complicated corporate structures and indebtedness of subsidiaries that may restrict the issuer's ability to obtain the cash flows necessary to service its debt.
* The current methodology as applied to the Municipal Opportunities Fund does not include the necessary specialized analysis for municipal securities. Among other items, tax-backed munis must be scrutinized as to the issuer's ability to maintain balanced budgets as well as to ensure that the issue has first priority of claims to revenue from public works projects. Revenue-backed munis require an assessment of the sufficiency of rate covenants to cover expenses and debt servicing of the underlying project as well as the ability for other government entities to access the revenues generated by the enterprise before they are passed on to revenue bondholders.
As part of his portfolio analysis, Thomas also examines yield volatility. Thomas makes the following statements:
Statement 1: Implied yield volatility estimates are based on the assumptions that the option pricing model is correct and that volatility is constant.
Statement 2: Yield volatility has been observed to follow patterns over time that can be modeled and used to forecast future volatility.
He concludes his analysis by comparing the swap rate curve to a government bond yield curve as a benchmark.
In accordance with his stated strategy, which of the companies included in Exhibit 1 should Thomas sell from the portfolio in anticipation of the credit rating updates?
Answer : C
Thomas's strategy is to sell securities of companies that he expects to have a credit rating downgrade in the near future. Accordingly, Thomas should be searching for a company with a deteriorating financial position. Financial deterioration would increase the likelihood of experiencing a default and consequently also increases the likelihood of experiencing a downgrade. Over the past three years, Company Y has experienced a decrease in the interest coverage ratio indicating a lessened ability to pay interest expenses out of operating income. Company Y has also experienced a decreasing level of cash flow relative to the firms total debt. Company Y's profitability increased slightly in the 2nd year but also experienced a large decrease in the 3rd year indicating instability of income. The company's ROE is stable but long-term debt is steadily increasing, which could be contributing to the stable ROE. Overall, Company Y has experienced the most negative events making it the most likely candidate for a downgrade and sale from the portfolio. (Study Session 14, LOS 51.d)
Question 6
Tobin Yoakam, CFA, is analyzing the financial performance of Konker Industries, a U .S . company which is publicly traded under the ticker KONK. Yoakam is particularly concerned about the quality of Konker's financial statements and its choices of accounting methodologies.
Below is a summary of Konker's financial statements prepared by Yoakam.
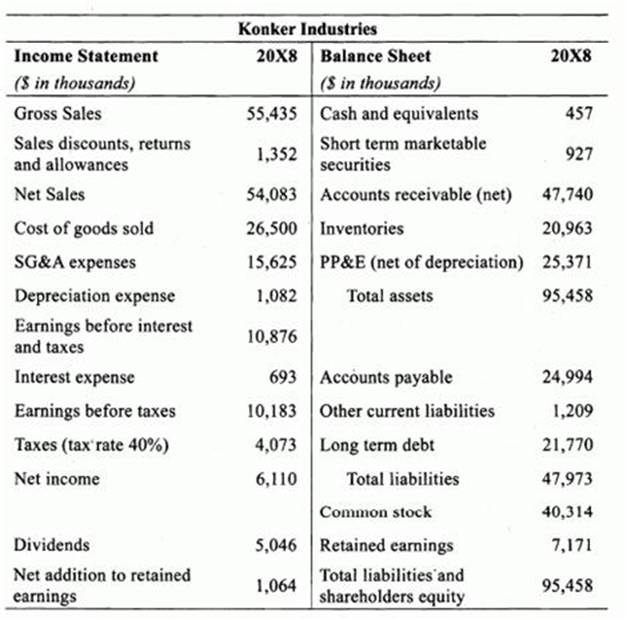
Konker has an operating lease for several of its large machining tools. The lease term expires in five years, and the annual lease payments are $2 million. The applicable interest rate on the operating lease is 9%. Yoakam believes that the operating lease should be capitalized and treated as a finance lease. For purposes of adjusting the financial statements, Yoakam believes that the machining tools should be depreciated using straight-line depreciation with a salvage value of $3 million.
At the beginning of 20X8, Konker formed a qualified special purposes entity (QSPE) and sold a portion of its accounts receivables to the QSPE. The total amount of accounts receivables sold to the QSPE was $13.5 million. Yoakam has noted in his research that the Financial Accounting Standards Board (FASB) is considering the elimination of qualified special purposes entities.
Konker has three major operating divisions: Konker Industrial, Konker Defense, and Konker Capital. Yoakam has computed the EBIT margin for each division over the last three years as well as the ratio of the percentage of total capital expenditures to the percentage of total assets for each division.

Since Yoakam is concerned about the quality of Konker's earnings, he decides to analyze the accrual ratios using the balance sheet approach. The table below contains the last three years of accrual ratios for Konker and the industry average.
Based on the balance sheet accruals ratios, Yoakam would most likely conclude which of the following regarding the earnings of Konker?
Answer : A
Volatile accruals ratios are an indicator that a firm may be manipulating earnings. Additionally, increasing accruals ratios may be a sign that a firm may be manipulat earnings. Lower accrual ratios represent higher earnings quality. (Study Session 7, LOS26.e)
Question 7
Bill Henry, CFA, is the CIO of IS University Endowment Fund located in the United States. The Fund's total assets are valued at $3.5 billion. The investment policy uses a total return approach to meet the return objective that includes a spending rate of 5%. In addition, the policy constraints established make tax-exempt instruments an inappropriate investment vehicle. The Fund's current asset mix includes an 18% allocation to private equity. The private equity allocation is shown in Exhibit 1.

The private equity allocation is a mixture of funds with different vintages. For example, within the venture capital category, investments have been made in five different funds. Exhibit 2 provides detail about the Alpha Fund with a vintage year of 2006 and committed capital of SI95 million.

The Alpha Fund is considering a new investment in Targus Company. Targus is a start-up biotech company seeking $9 million of venture capital financing. Targus's founders believe that, based on the company's new drug pipeline, a company value of $300 million is reasonable in five years. Management at Alpha Fund views Targus Company as a risky investment and is using a discount rate of 40%. After a thorough analysis of Targus's future prospects, Alpha Fund's management believes that there is a possible 15% risk of failure for the company.
Using Exhibit 2 and assuming a 20% carried interest, the Alpha Fund's 2008 dollar amount of carried interest is closest to:
Answer : B
$195 million Alpha Fund (all daca in millions)
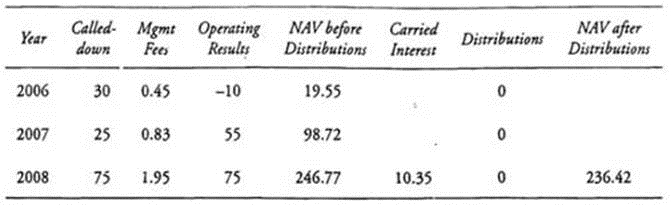
2006 NAV before distributions = 30 - 0.45 + (-10) = 19.55
2007 NAV before distributions = 19.55 + 25 - 0.83 + 55 - 98.72
2008 NAV before distributions = 98.72 + 75 - 1.95 + 75 = 246.77
When NAV before distribution exceeds committed capital, the 20% carried interest is applied. (246.77 - 195) * 0.2 - 51.77 = 0.2 = 10.35
In years 2009 and beyond, the 20% carried interest is applied to the change in NAV before distributions. For example, if the 2009 NAV before distributions was 296.77, then the carried interest would equal (296.77 - 246.77) x 0.2 = 50 x 0.2 = 10.
The NAV after distributions subtracts carried interest and distributions from NAV before distributions.
(Study Session 13, LOS 47.i)