Page: 1
/ 14
Total 50 questions
Adobe Analytics Business Practitioner Expert AD0-E208 Exam Practice Test
Question 1
An analyst wants to exclude visits where a page with the name "Shopping Checkout" was viewed.
How would these visits be excluded from a report?
Answer : C
The best way to exclude visits where a page with the name ''Shopping Checkout'' was viewed is to use a visit-based segment with one exclude condition: Page equals ''Shopping Checkout''. This will ensure that only the visits that did not include any hit where Page equals ''Shopping Checkout'' are included in the report. A hit-based segment with one exclude condition: Page equals ''Shopping Checkout'' will not work, as it will only exclude the hits where Page equals ''Shopping Checkout'', but not the entire visits. A visit-based segment with one include condition: Page does not equal ''Shopping Checkout'' will not work either, as it will include any visit that had at least one hit where Page does not equal ''Shopping Checkout'', even if it also had a hit where Page equals ''Shopping Checkout''.
References: https://experienceleague.adobe.com/docs/analytics/components/segments/segment-tips.html?lang=en https://experienceleague.adobe.com/docs/analytics/components/segments/segment-tips.html?lang=en#exclude-visits-with-a-specific-page
Question 2
What is a valid use of a segment as a touchpoint in a Fallout Visualization?
Answer : B
A valid use of a segment as a touchpoint in a Fallout Visualization is to use a visit-based segment as a touchpoint inside a visit-context Fallout Visualization. This means that the segment will apply to the entire visit and the fallout will show the conversion within the same visit. Using a visitor-based segment as a touchpoint inside a visit-context Fallout Visualization or using a visit-based segment as a touchpoint inside a visitor-context Fallout Visualization are not valid uses, as they will cause mismatched scopes and inaccurate results.
References: https://experienceleague.adobe.com/docs/analytics/analyze/analysis-workspace/visualizations/fallout.html?lang=en#segment-touchpoints https://experienceleague.adobe.com/docs/analytics/analyze/analysis-workspace/visualizations/fallout.html?lang=en#fallout-visualization-scopes
Question 3
An analyst is co-creating a report with their client counterpart in preparation for a running marketing performance dashboard. Marketing is still getting onboarded with the analytics tool and hope to begin leveraging data to enable data-driven decisions.
How would the analyst look to share out the dashboard broadly across the team?
Answer : B
The best way to share out the dashboard broadly across the team is to share Can Edit rights with the client counterpart and Can View rights with the entire marketing team. This will allow the client counterpart to co-create and modify the dashboard with the analyst, while the rest of the marketing team can view and interact with the dashboard without making any changes. Sharing a PDF at the time the report is completed would not allow for any interactivity or updates, and sharing Can Duplicate rights with the entire marketing team would create unnecessary copies of the dashboard.
References: https://experienceleague.adobe.com/docs/analytics/analyze/analysis-workspace/share/share-project.html?lang=en https://experienceleague.adobe.com/docs/analytics/analyze/analysis-workspace/share/share-project.html?lang=en#sharing-a-project
Question 4
A business owner is reviewing quarterly financial data and looks to complete projections for the upcoming quarter.
Which tool should be used to enable this analysis?
Answer : A
Adobe Experience Platform is a tool that enables data integration, analysis, and visualization across different sources and channels. It can help business owners to review historical data and create projections for the future.
References: https://experienceleague.adobe.com/docs/experience-platform/landing/home.html?lang=en
Question 5
Exhibit.
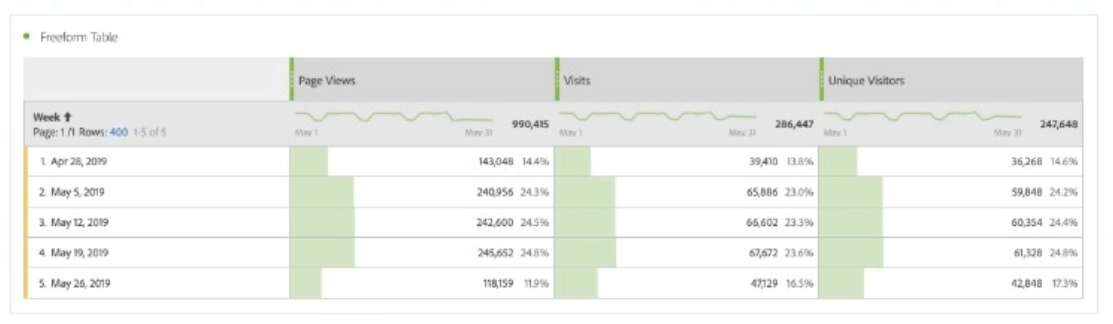
A business stakeholder receives a Workspace report that indicates that data is incorrect. The sums of the items in the rows do not match the total metric values of the columns in the unique visitors and visits report.
Which statement about the report is true?
Answer : A
Unique visitors and visits are de-duplicated metrics, which means that they do not add up linearly across dimensions. For example, if a visitor visits two pages in one visit, the total number of unique visitors and visits for those two pages is still one, not two. Therefore, the total row in the table shows the actual number of unique visitors and visits for the whole site, not the sum of the values in the table.
References: https://experienceleague.adobe.com/docs/analytics/components/metrics/unique-visitors.html?lang=en https://experienceleague.adobe.com/docs/analytics/components/metrics/visits.html?lang=en
Question 6
Two single condition Segments are set up for creating a Virtual Report Suite. Both Segments are visit scoped and have the following rule using default Dimensions:
Segment A: Marketing Channel equals 'Social Networks' Segment B: Countries equals 'United Kingdom'
Which data subset of the source Report Suite will be available when using this Virtual Report Suite?
Answer : B
The data subset of the source report suite that will be available when using this virtual report suite is visit data for visits coming from a Social Network AND from the United Kingdom. This is because when two single condition segments are set up for creating a virtual report suite, they are combined with an AND logic. This means that only the visits that match both segments will be included in the virtual report suite.
References: https://experienceleague.adobe.com/docs/analytics/components/virtual-report-suites/vrs-overview.html?lang=en https://experienceleague.adobe.com/docs/analytics/components/virtual-report-suites/vrs-overview.html?lang=en#creating-a-virtual-report-suite
Question 7
A spike in traffic is observed for a specific day. Knowing that there are no campaigns running, the first hypothesis is that this is bot traffic.
Which Adobe Analytics tool may be used to identify the IP of the user that contributes to this spike in traffic without using a custom variable?
Answer : A
Data Warehouse is a tool that allows you to run custom queries on raw data and export the results to various formats. It can also provide the IP address of the user as a dimension, which can help identify bot traffic without using a custom variable.
References: https://experienceleague.adobe.com/docs/analytics/export/data-warehouse/data-warehouse.html?lang=en https://experienceleague.adobe.com/docs/analytics/components/dimensions/ip-address.html?lang=en